Next.js with Kubiks
This template has the minimal configuration to make use of the Kubiks integration. Get deep insights into performance, errors, and user experience with OpenTelemetry-native instrumentation.
Complete Observability
Everything you need to monitor, debug, and optimize your Node.js applications.
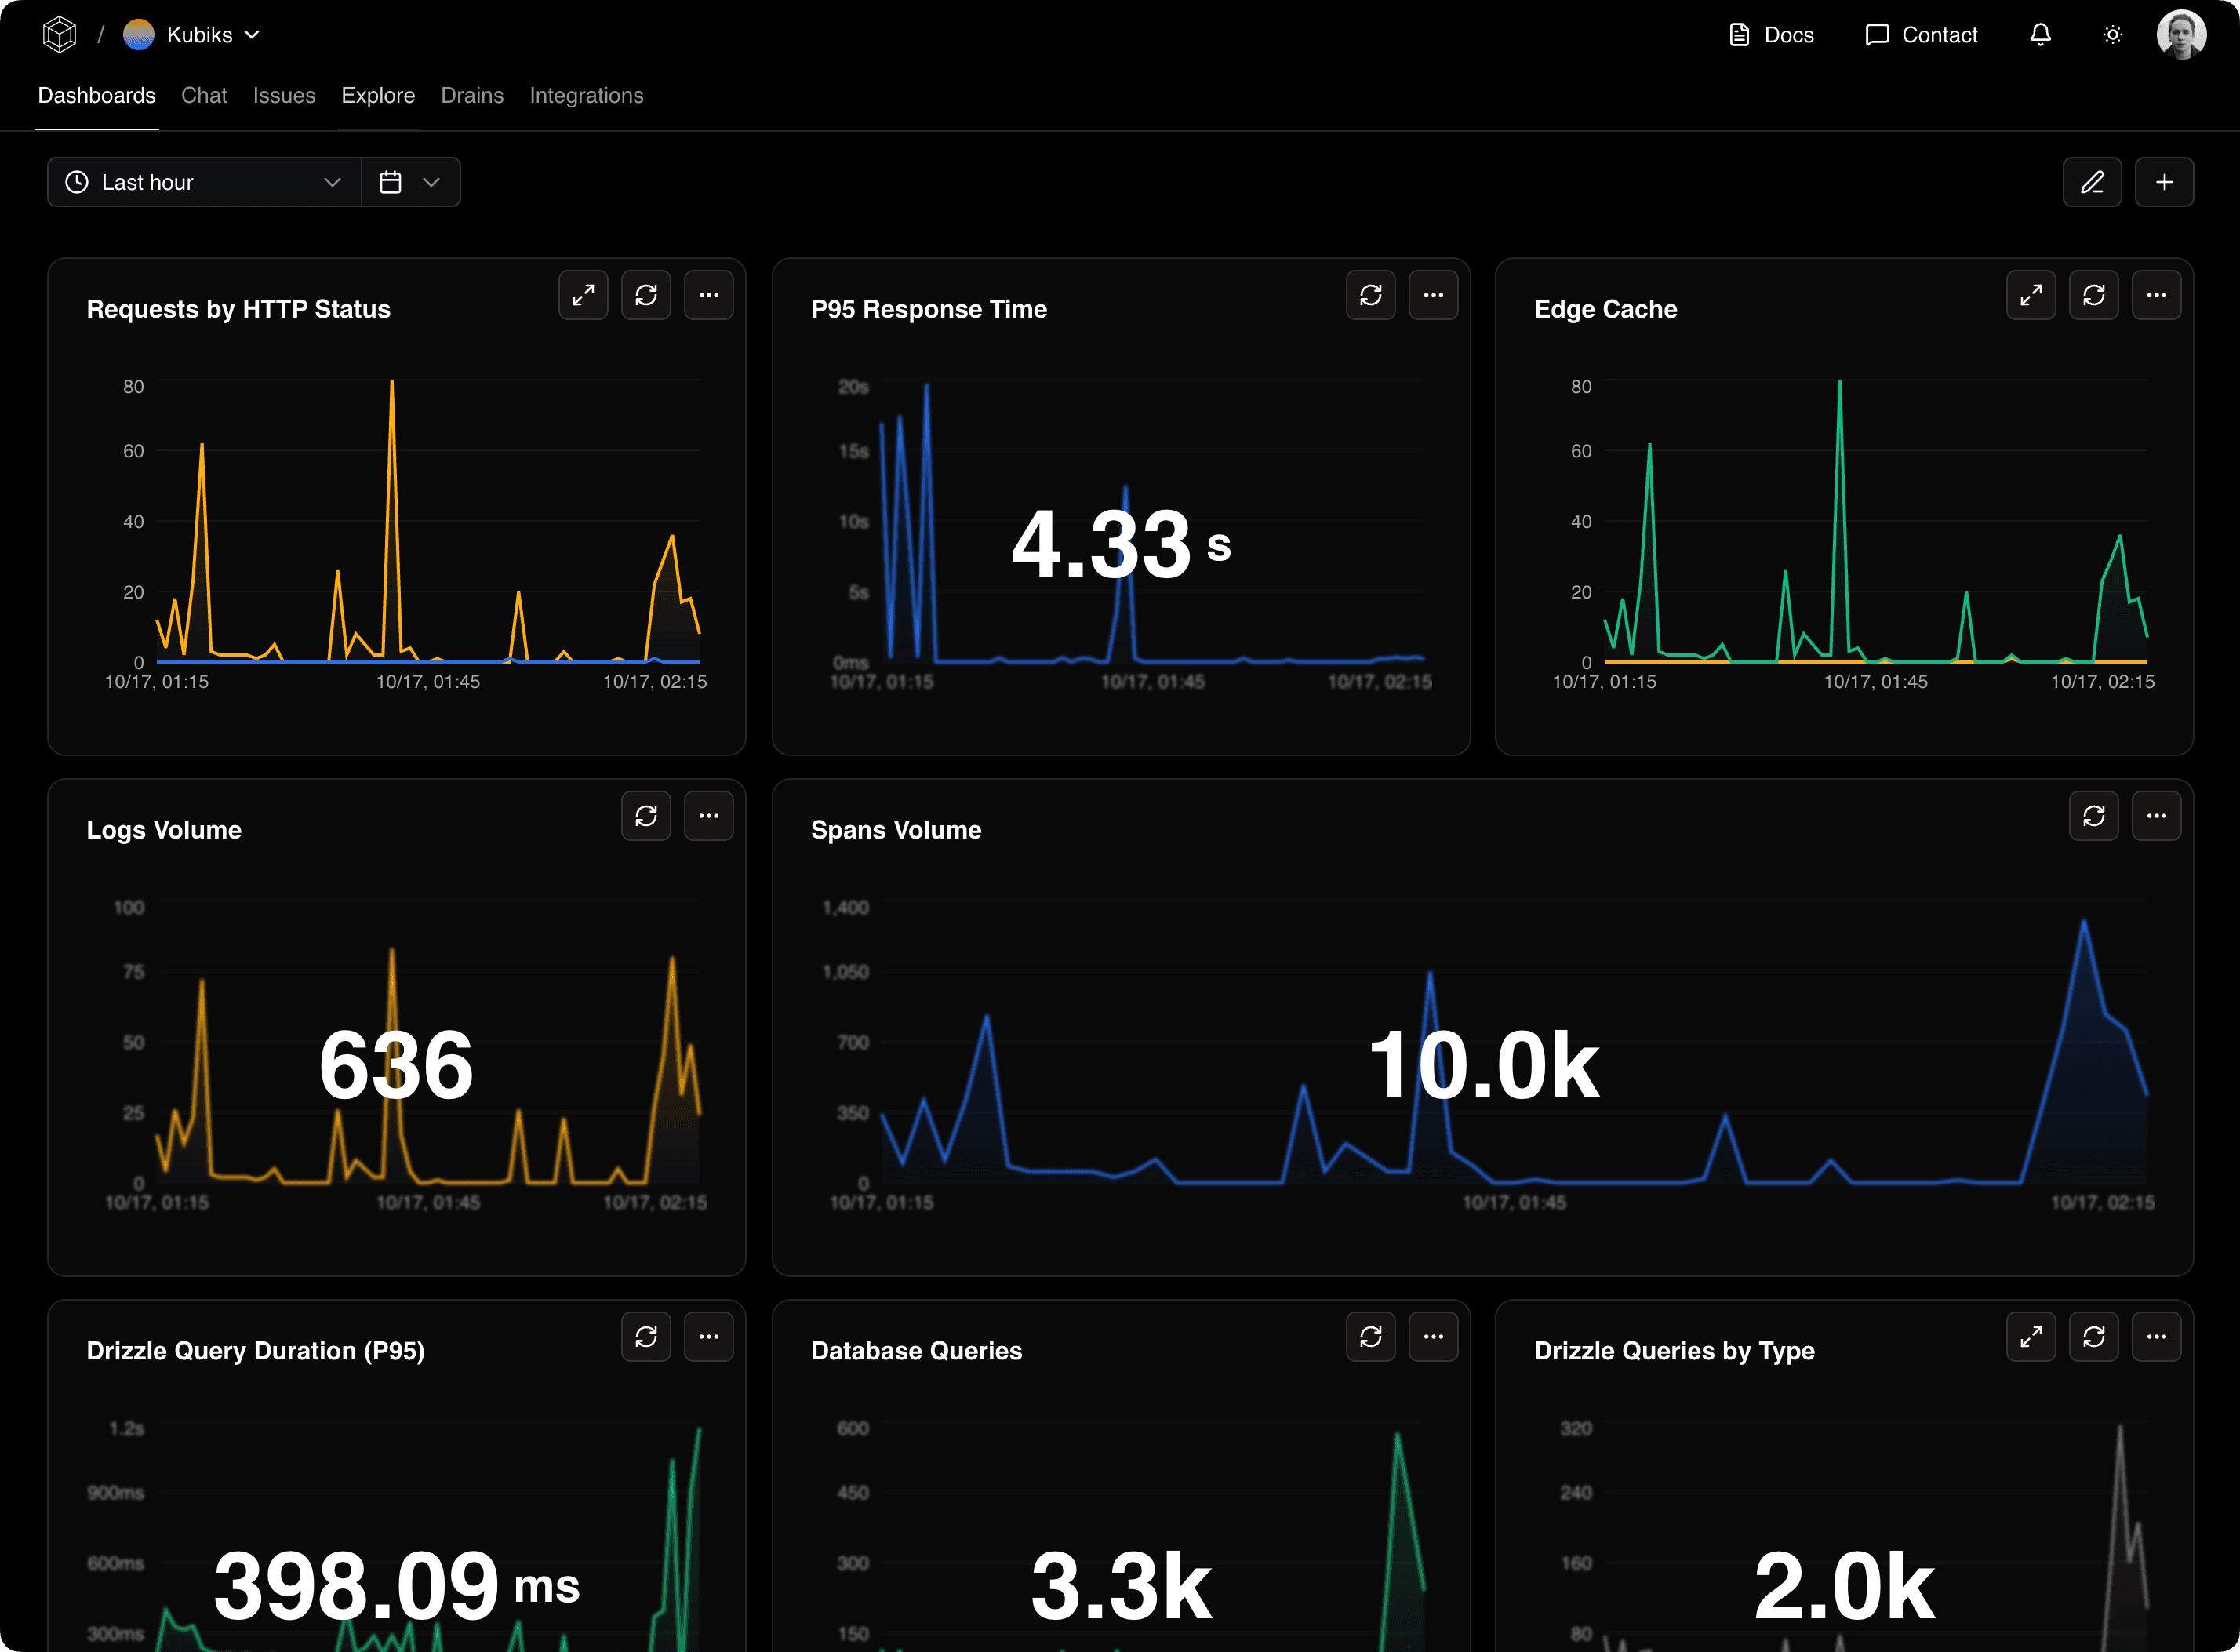
Real-time Dashboards
Monitor your entire application with customizable dashboards. Track requests, errors, performance metrics, and more in real-time.
Distributed Tracing
Follow requests across your entire stack. See database queries, API calls, and third-party integrations in a single trace view.
Error Tracking
Automatic error detection and grouping with full stack traces. Get notified immediately when issues occur in production.
Performance Analytics
Track latency, throughput, and error rates. Identify bottlenecks with p50, p95, and p99 metrics.
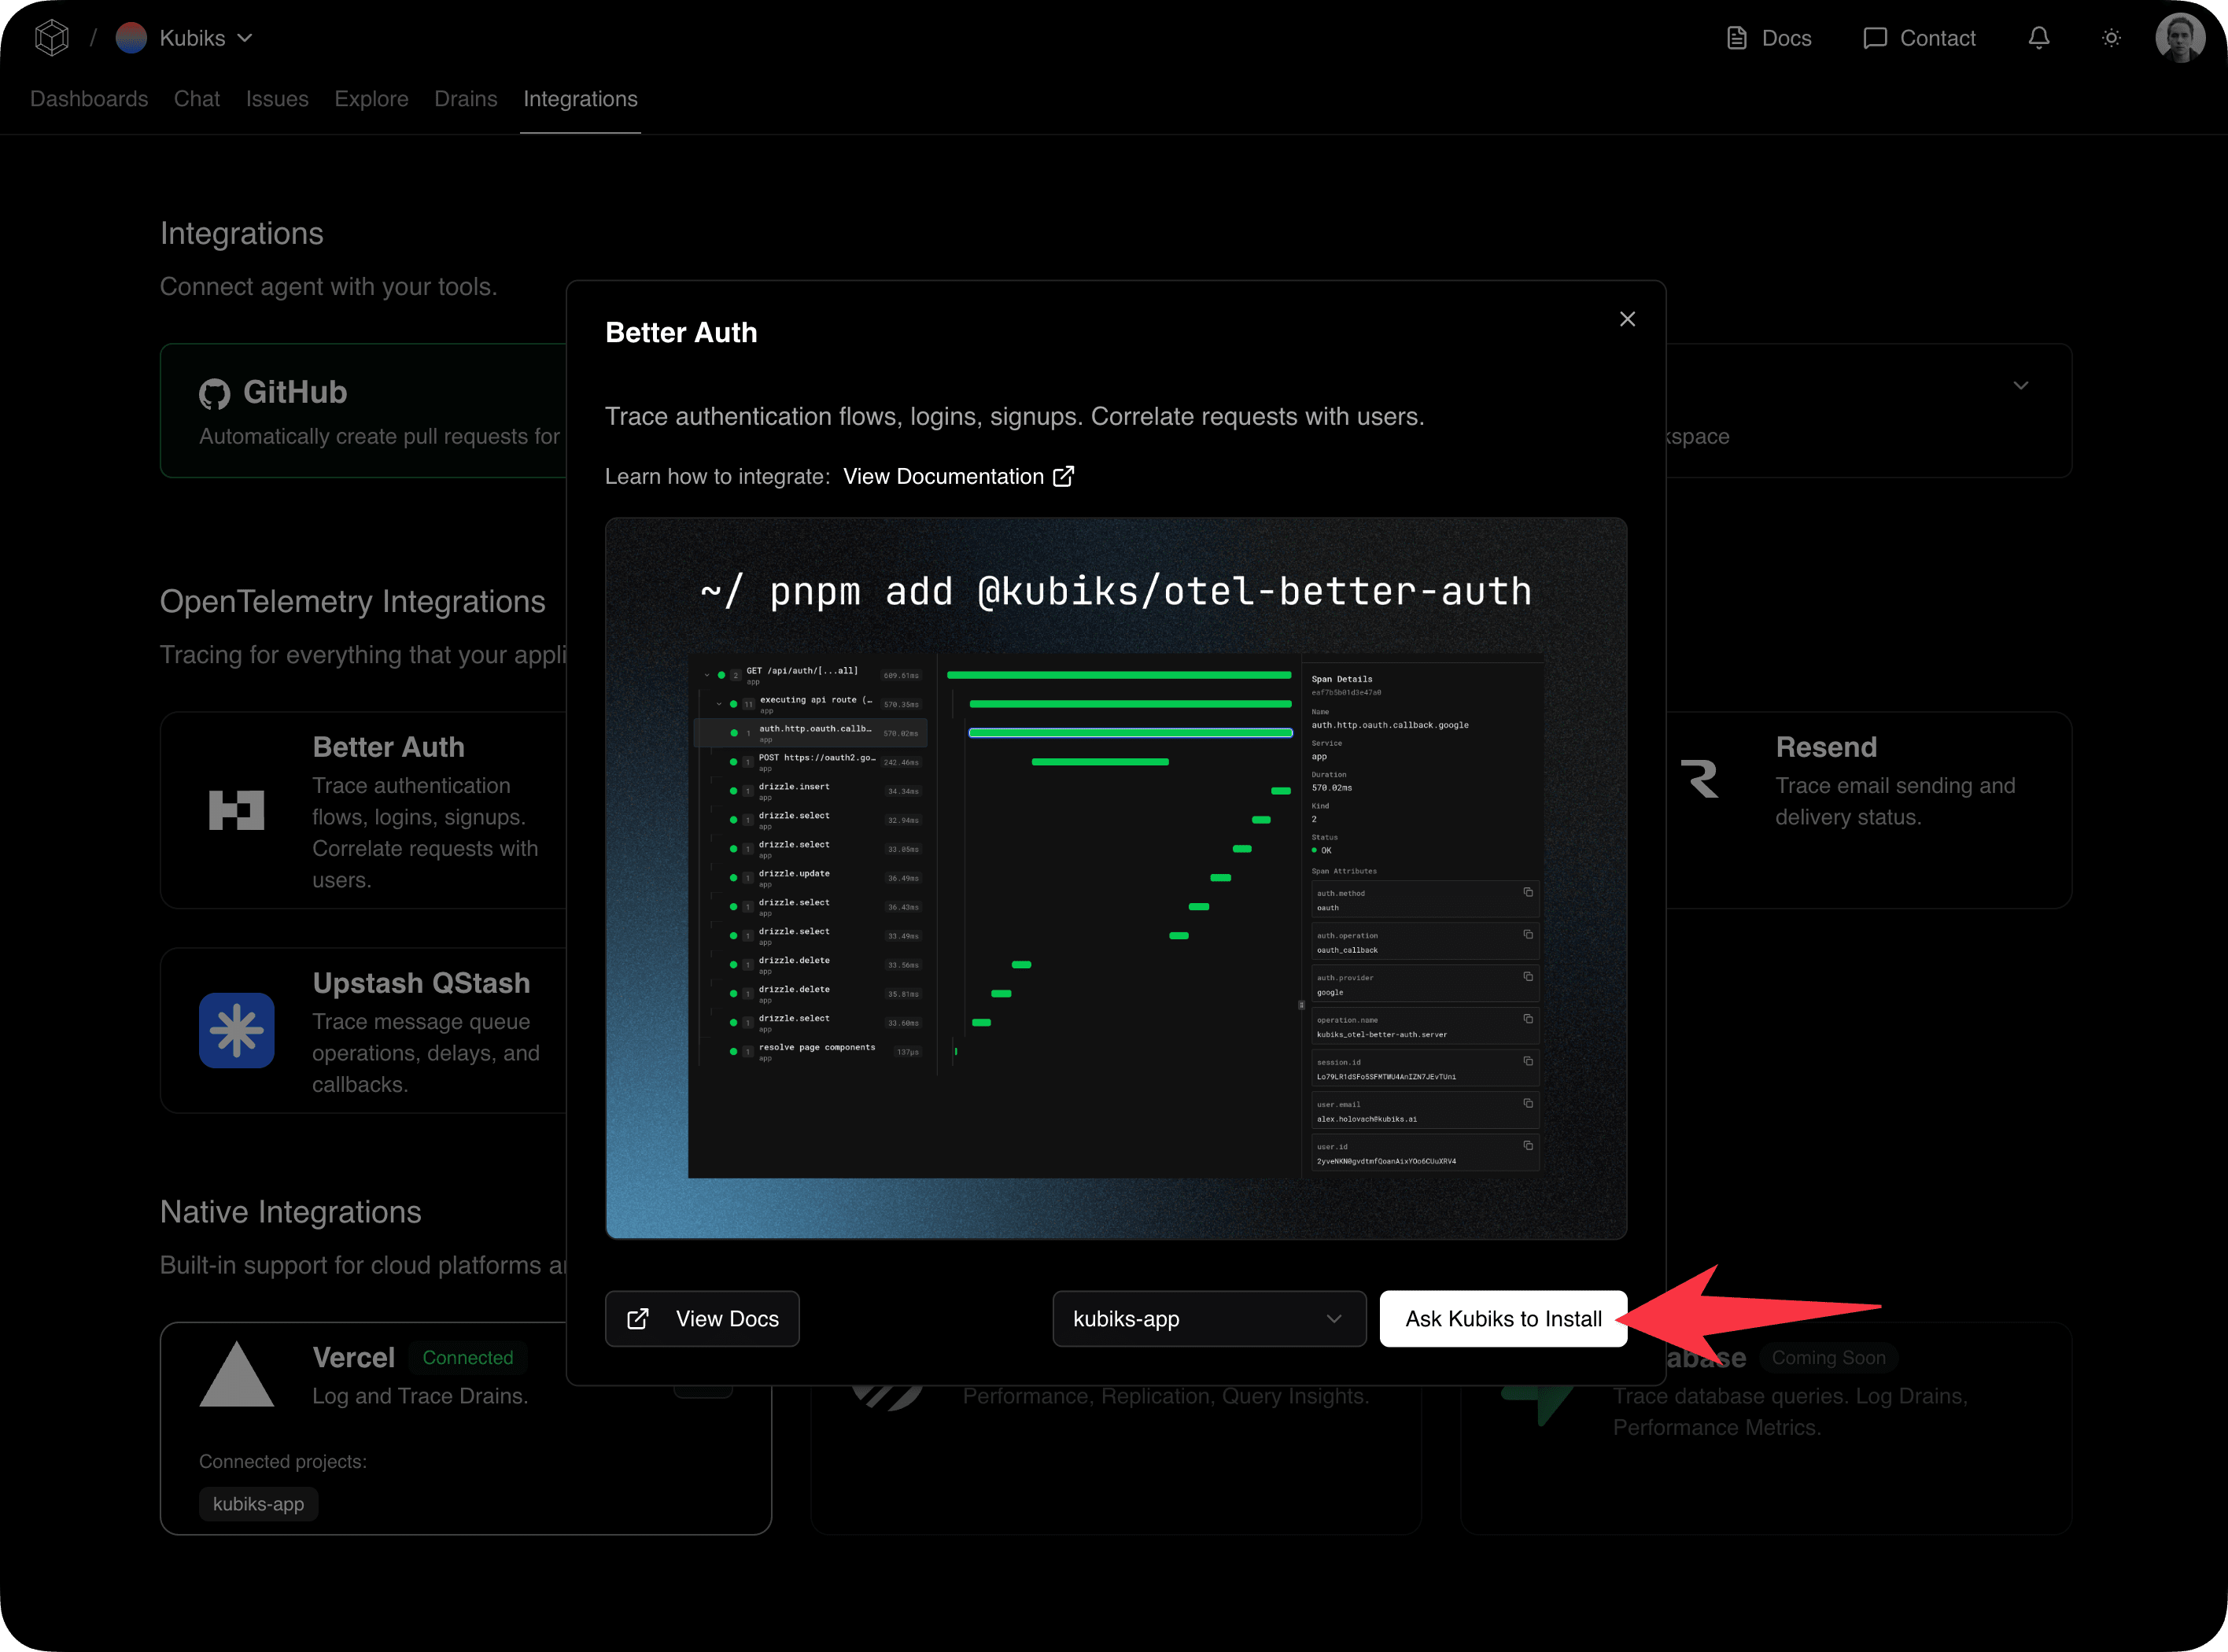
Drop-in Integrations
Add automatic tracing to popular tools with a single line of code. All integrations are open source and MIT licensed.
Install with AI in Seconds
After deploying, our AI automatically installs and configures integrations for your stack based on what you're using.
View all integrations and contribute new ones
Browse Documentation →